So the first step was to generate the summary for a specific machine. I got most of this code from Garth Jones, he's a wizard when it comes to queries so if I'm looking for something he's usually my first stop.
SELECT
CS.Name0 AS System, CS.UserName0 AS 'User',
SUM(CASE WHEN UCS.Status = 2 THEN 1 ELSE 0 END) AS Missing,
SUM(CASE WHEN UCS.Status = 3 THEN 1 ELSE 0 END) AS Installed,
ROUND((SUM(CONVERT(float, CASE WHEN UCS.Status = 3 THEN 1 ELSE 0 END))
/ (SUM(CONVERT(float, CASE WHEN UCS.Status = 2 THEN 1 ELSE 0 END))
+ SUM(CONVERT(float, CASE WHEN UCS.Status = 3 THEN 1 ELSE 0 END))))
* 100, 2) AS Compliance, WS.LastHWScan
FROM
v_Update_ComplianceStatus AS UCS
LEFT OUTER JOIN v_GS_COMPUTER_SYSTEM AS CS
ON CS.ResourceID = UCS.ResourceID
JOIN v_CICategories_All AS CI
ON CI.CI_ID = UCS.CI_ID
JOIN v_CategoryInfo AS NFO
ON NFO.CategoryInstance_UniqueID
= CI.CategoryInstance_UniqueID
AND NFO.CategoryTypeName
= 'UpdateClassification'
LEFT JOIN
v_GS_WORKSTATION_STATUS AS WS
ON WS.ResourceID = CS.ResourceID
LEFT JOIN
v_FullCollectionMembership AS FCM
ON FCM.ResourceID = CS.ResourceID
WHERE
(UCS.Status IN (2, 3))
AND (CS.Name0 = '<SomeServer>')
AND FCM.CollectionID = '<SomeCollectionID>'
AND NFO.CategoryInstanceName =
'Critical Updates'
GROUP BY
CS.Name0,
CS.UserName0,
WS.LastHWScan
This will return something like this:
Sytem User Missing Installed Compliance Last Scan
<servername> NULL 0 2 100 2013-10-31 19:21:12.000
That's great! Now to move it over to Report Builder and make it usable. First open report builder, and select Table or Matrix Wizard. Select 'Create a dataset', and use your Data Source (connecting with whatever account you have for building reports). On the Design a query page, click 'Edit as Text', and paste in the base query.
This is where we do the first modification. Change = <SomeServer>, <SomeCollectionID>, and = 'Critical Updates' to Like @NameFilter, @CollectionID, and Like @UpdateType respectively. That way report builder will prompt you for those fields later. *This is a good time to hit the ! button and test it. Changing = to Like lets you put some wild cards into the finished product.

(edit: I didn't originally change =@CollectionID to LIKE, I did it after the screenshot...)
Hmm, I can already see one machine I have to look at. So that's your first dataset, now to make it cool. Click next. System is your Row Group, the rest are values. On the next screen, I uncheck Show Subtitles and Expad/collapse groups. This is a summary and I want it really squished. Use your favorite style. I'm partial to Corporate. Ok now you can run it if you want, I know you will anyway. But next I'm going to make it easier.
Expand Parameters and you'll see the three @Parameters you built earlier. Pretty cool that it auto-populates that. Any way, edit @NameFilter (r-click, properties). In General change the prompt to "Enter Name Filter (% for all)". On Default Value enter the filter you use most often followed by a % for the wildcard, ie I use the 3 digit code that specifies machines near me. If you want to look at all first, Default it to %. But I have several thousand workstations so I work on a subset at a time.
Ok, new cool stuff. You saw the 'Get Values from a query' option in there didn't you? You want to try it don't you? Uh, how you ask? Well first you need another dataset just for your drop down. So right click datasets and select add dataset. Select 'Use a dataset embedded...', choose your data source, and paste something like the following in the query box.
Select
CollectionID,
Name AS CollectionName,
CollectionID+' - ' +Name AS NameSort
From
v_Collection
ORDER BY
Name
Now in the @CollectionID properties, change the Prompt to 'Select Collection: '. In Available Values, select 'Get values from query'. Select your new Data Set, should be Data Set 2. Value field is what you want returned, the CollectionID, and the Lable Field is what you'll see in the selection, use NameSort. In Default Values, select Specify Values and enter the CollectionID that you want to use as a default.
For @UpdateType I'm going to use the Specify Values option for Available Values. I could to a query and find all the types, but I also what to be able to specify All, and if you get from a query you can't add to it. So click add for each of the following and specify:
(Label / Value)
All / %
Critical Updates / Critical Updates
Security Updates / Security Updates
Definition Updates / Definition Updates
Feature Packs / Feature Packs
Service Packs / Service Packs
Update Rollups / Update Rollups
Updates / Updates
I set the default to Critical Updates. Up to you.
Run it! Still needs some clean up but we'll get to that when we add some more to the report.
So what else can we add? Well the first thing someone always asks me for is an overall compliance status. You could export all this data to Excel and add everything together and get a number, but I don't like by boss's boss to talk to me so I just want to include it on the report. Next step, add another new data set that says this (look familiar? it just removes grouping from the original report):
SELECT
Count(DISTINCT CS.Name0) AS 'Total Systems',
SUM(CASE WHEN UCS.Status = 2 THEN 1 ELSE 0 END) AS 'Total Missing',
SUM(CASE WHEN UCS.Status = 3 THEN 1 ELSE 0 END) AS 'Total Installed',
ROUND((SUM(CONVERT(float, CASE WHEN UCS.Status = 3 THEN 1 ELSE 0 END)) /
(SUM(CONVERT(float, CASE WHEN UCS.Status = 2 THEN 1 ELSE 0 END)) +
SUM(CONVERT(float, CASE WHEN UCS.Status = 3 THEN 1 ELSE 0 END)))) * 100, 2)
AS 'Overall Compliance',
ROUND(SUM(CONVERT(float,CASE WHEN UCS.Status = 2 THEN 1 ELSE 0 END)) /
CONVERT(float, Count(DISTINCT CS.Name0)), 2) AS 'Average Missing'
FROM
v_Update_ComplianceStatus AS UCS
LEFT OUTER JOIN v_GS_COMPUTER_SYSTEM AS CS ON CS.ResourceID = UCS.ResourceID
JOIN v_CICategories_All AS CI ON CI.CI_ID = UCS.CI_ID
JOIN v_CategoryInfo AS NFO ON NFO.CategoryInstance_UniqueID = CI.CategoryInstance_UniqueID AND NFO.CategoryTypeName = 'UpdateClassification'
LEFT JOIN v_GS_WORKSTATION_STATUS AS WS ON WS.ResourceID = CS.ResourceID
LEFT JOIN v_FullCollectionMembership AS FCM ON FCM.ResourceID = CS.ResourceID
WHERE
(UCS.Status IN (2, 3))
AND (CS.Name0 LIKE @NameFilter)
And FCM.CollectionID = @CollectionID
and NFO.CategoryInstanceName LIKE @UpdateType
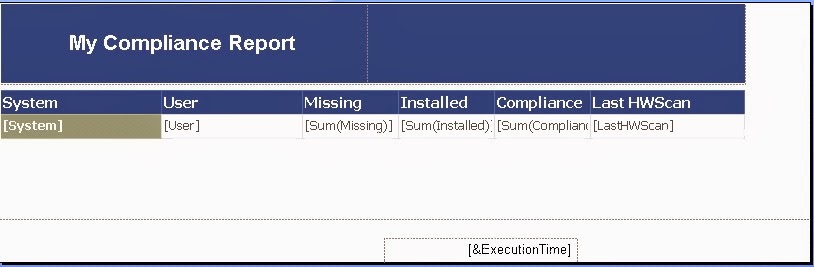
Now to make the report pretty and add in the summary. I don't use the default title bar. Deleted. Expand out the table cells so that all your data fits nicely. I rarely print these so I don't care about margins (if I need to print, that's what export to Excel is for). Then I add a color coodinating top bar with a nifty title. So far:
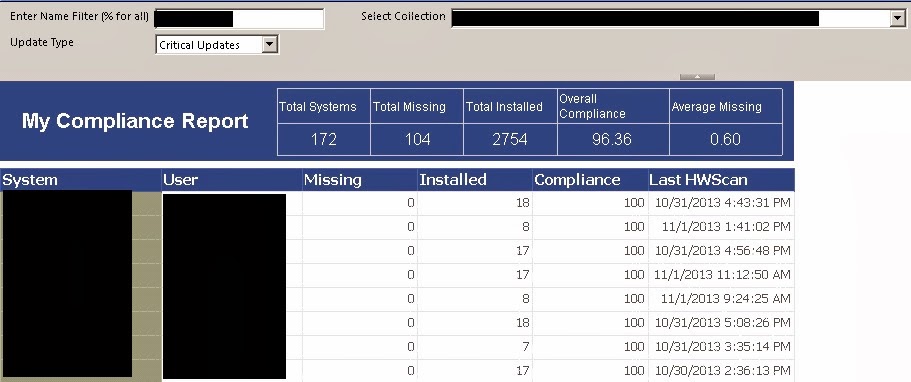
Next add a table in that empty blue spot. Don't use the wizrd, just insert it, then drag your totals and averages from the latest dataset up to it. Then re-size everything to make it look sexy. Note, to get the decimal places to show under average missing I had to change it from Default to Number format in the text box properties... And here we go:
Next, when I get around it it, I'll do some more report linking, and I've got a pretty cool 3rd Party compliance tracking report that I use a lot to put up. And that one uses charts!
No comments:
Post a Comment